Consumer attention research,
delivered.
Pagegazer is the full service platform for consumer attention research. We consult with you on the research design, build and run the study, analyze it, and deliver the findings.
Webcam eye tracking, heart rate, facial expressions, and behavioral choice analytics on websites, packaging, ads, and more.
Trusted by top researchers at leading organizations


Four signals, measured simultaneously
All four run together in the browser, on real stimuli, client-side and privacy-guaranteed, no hardware required.
Eye tracking
Where attention goes, validated to 1.4° accuracy against laboratory systems.
Behavioral data
Clicks, scrolls, navigation paths, reaction times, choices.
Facial expression
Emotional response to content, moment by moment.
Heart rate (rPPG)
Physiological engagement and arousal during interaction.
These implicit signals are paired with surveys and self-report in the same study to compare what people do with what they say, and break the results down by demographics, attitudes,and other survey responses. See the methodology.
Case Study
When behavior alone tells half the story.
A real example with altered names and designs.
Background
A consumer-goods team evaluated two redesigns of their cereal flagship brand, one flashy and attention-grabbing, one quieter and nutrition-focused. They needed to pick one to launch.
Study Design
Task 1 — Eye-tracking on a realistic shelf
Participants (N=150) saw the brand's competitive shelf with one of the two new designs inserted in the target position (randomised across the 2nd and 3rd shelf rows to control for vertical-position effects). They had up to 10 seconds to make a choice and click the pack they would buy. The task measured attention (eye-tracking) and choice (behavioral data) in parallel.
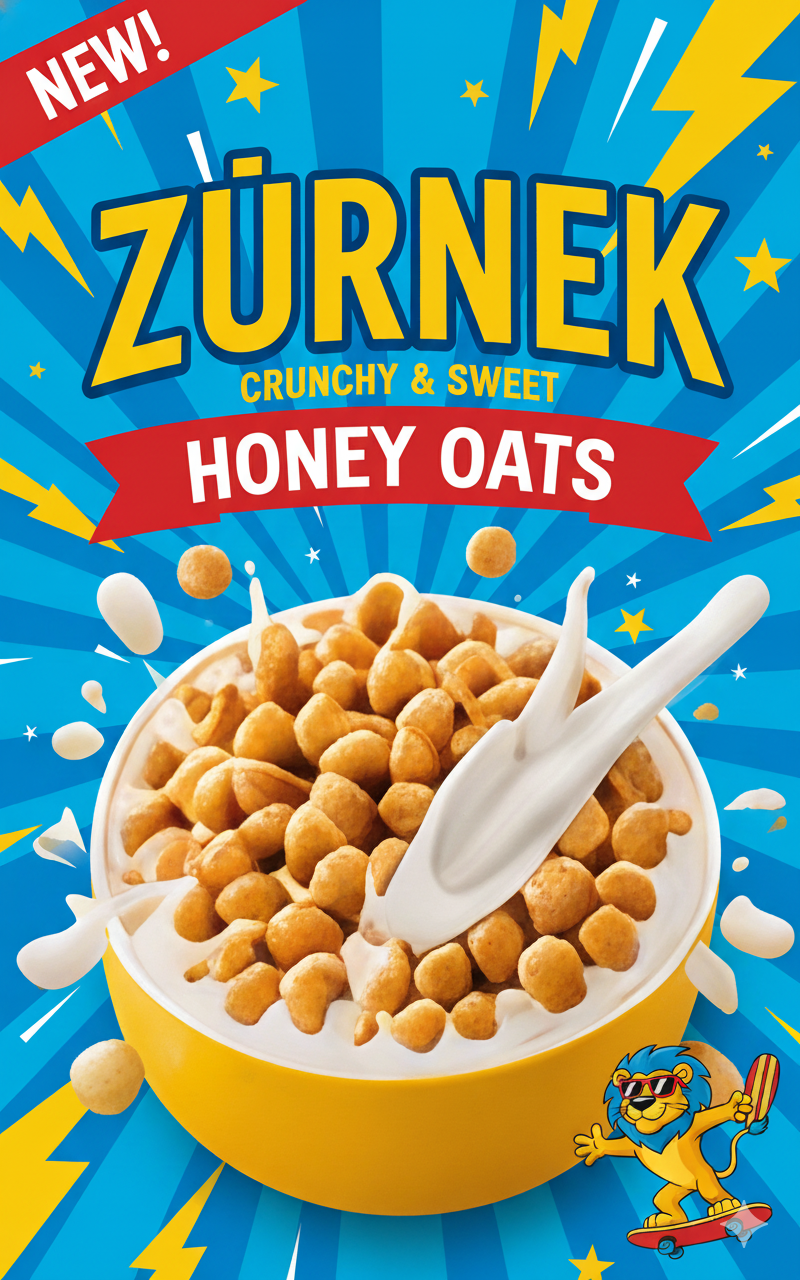
Variant A — Flashy design*
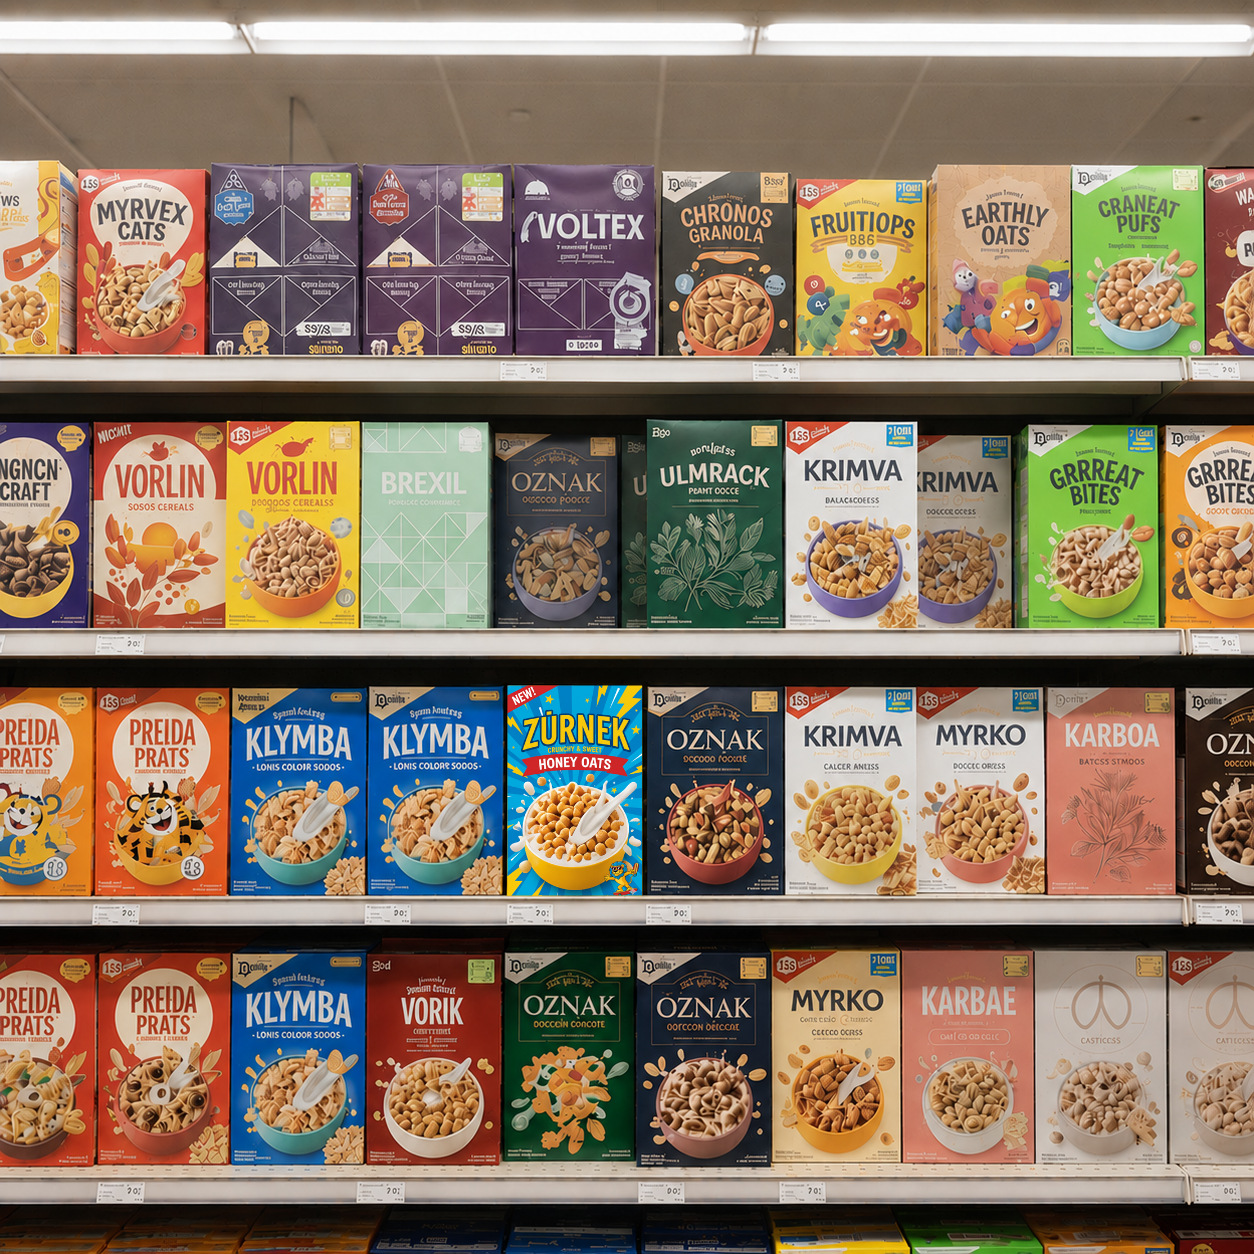
Variant B — Toned-down design*
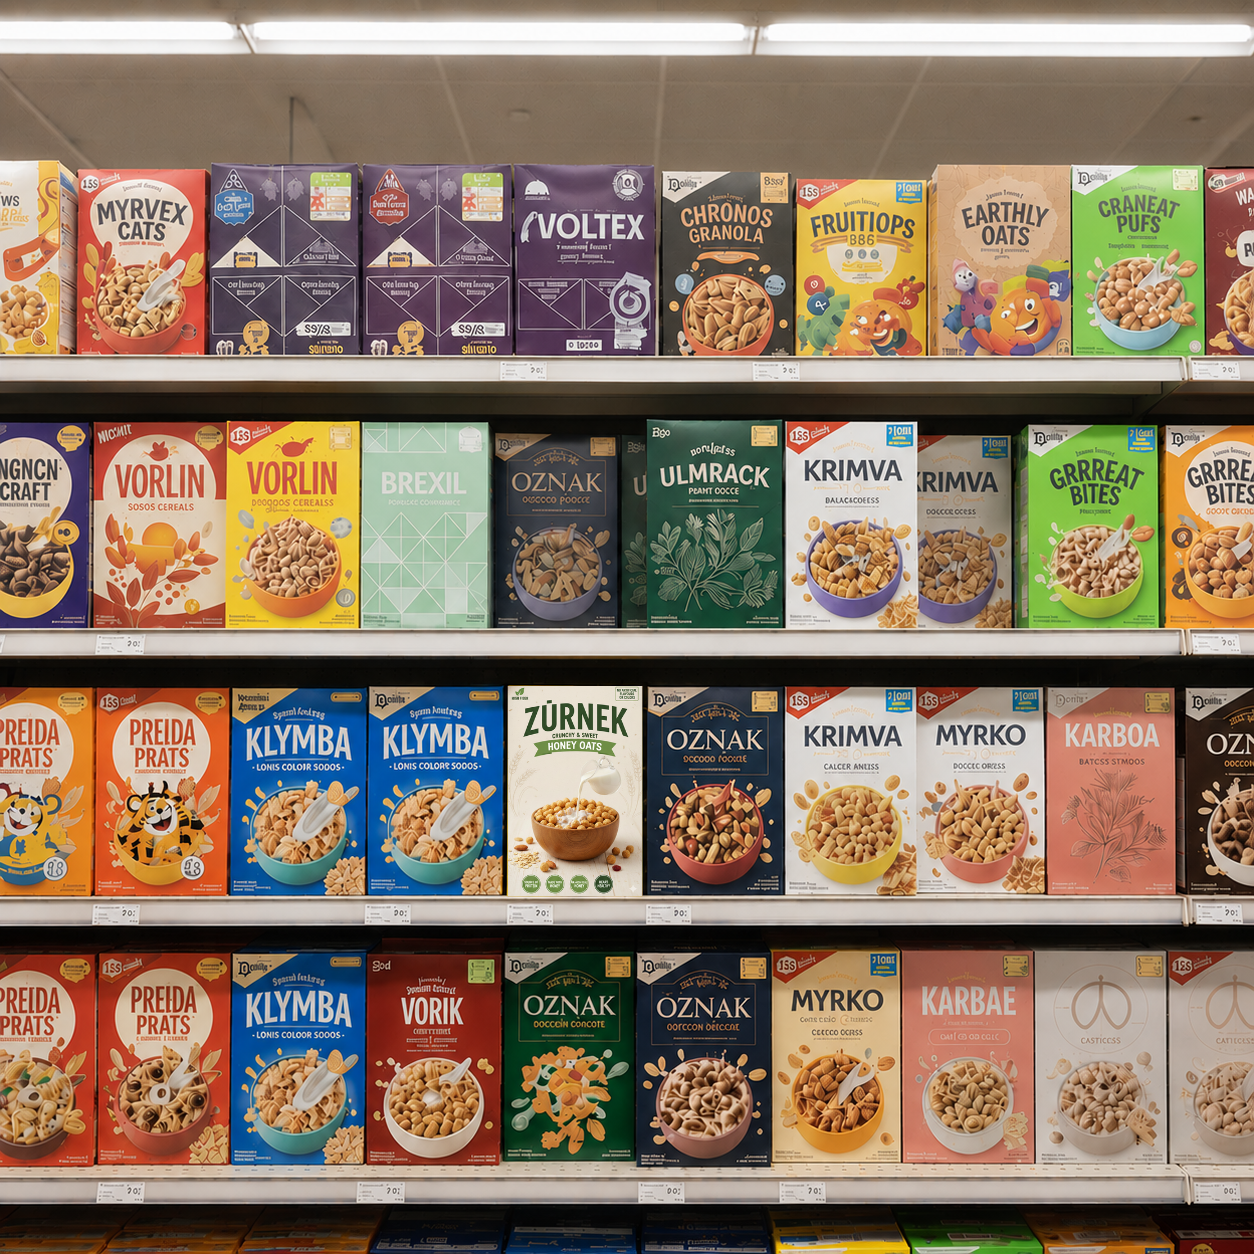
On the shelf, the flashy design is found earlier, holds attention longer, and is picked more often. The gap on picks is narrower than the gap on attention, but the flashy design still wins the shopping decision in a realistic scenario.
Task 2 — Head-to-head preference, in isolation
The same two designs were then presented side by side, no shelf, no competitors. Participants picked which they prefer.
Variant A — Flashy design*
Variant B — Toned-down design*
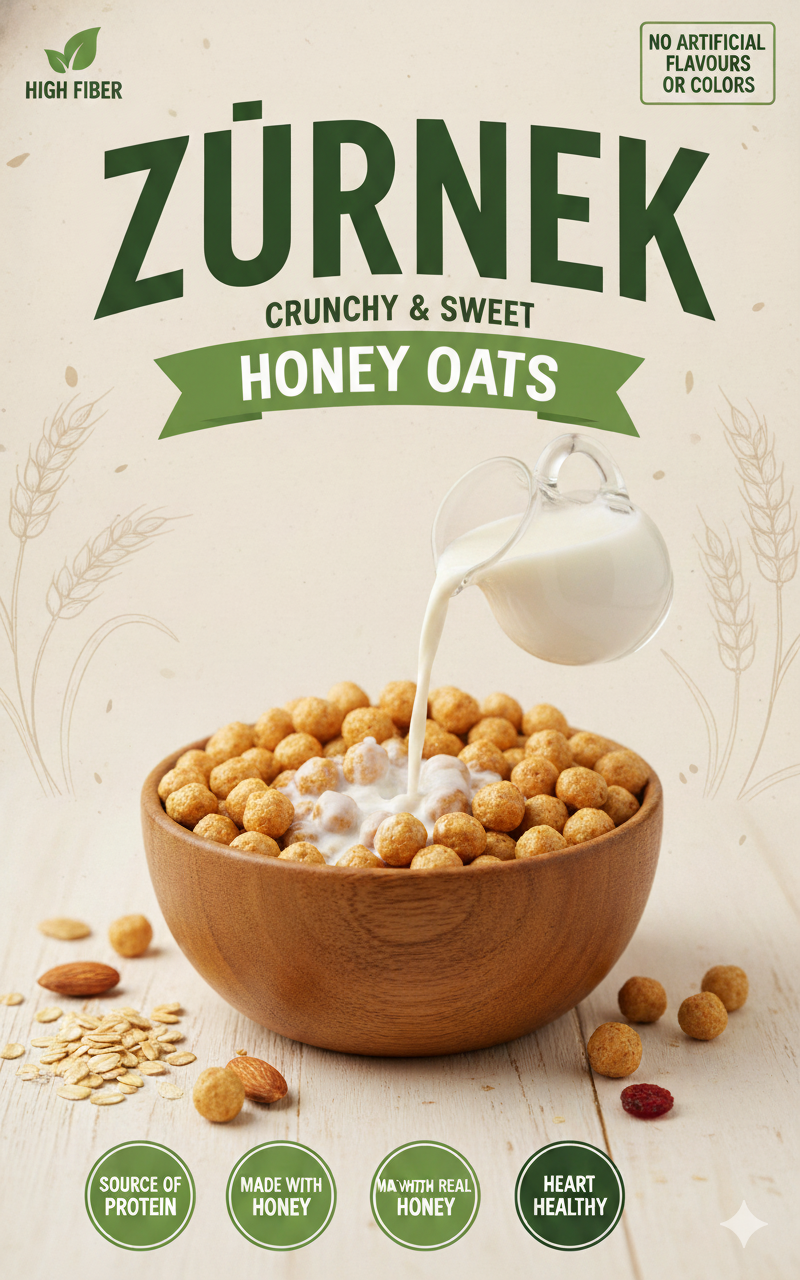
In the out-of-shelf context, the quieter nutrition-focused design won by a clear margin, with almost two-thirds of subjects preferring it directly.
* The packaging shown here is not the client's original design. Brand names, colour palette, and typography have all been altered to ensure confidentiality. The pattern of findings is preserved.
Findings & Decision
Looking at the behavioral outcome alone, the data was ambiguous: a small-medium win for the flashy design on the shelf, but a clear win for the toned-down design in isolation. Without more data to explain the discrepancy, it would have been hard to make a confident decision. Our eye-tracking data explained the discrepancy perfectly. Even though the toned-down design was preferred in isolation, it was much harder to find on the shelf. And in a time-constrained environment, which a shopping trip is, that translated to fewer picks. The client could now make a confident decision: the flashy design was the right choice for this brand in this competitive shelf context.
Why our eye-tracking mattered
Both tasks are valid. They simply ask different questions. The head-to-head method asks: "which design appeals more when you look only at the design?" The shelf method asks: "which design wins in the environment where the purchase decision actually happens?"
Behavioral data alone can produce contradictory answers with no way to explain them. Attention measurement turns "we don't know which signal to trust" into "we know exactly what's driving each outcome".
Have a similar branding or packaging question?
Submit a project enquiry →What working researchers say about the platform
Independent reviews of Labvanced, the platform Pagegazer studies run on.

"A state-of-the-art experiment engine that is fully accessible through its intuitive GUI, eliminating the barrier of programming knowledge. This power, combined with their always-available and highly responsive support team, makes it the best platform for our high-quality online research."

"This was the only platform where eye-tracking was available so we could adapt our study. The eye-tracking algorithm has been constantly improved and features for developmental studies were introduced as well."

"It appears to be the easiest and most complete way to create behavioral online experiments. The possibility to add homemade JavaScript is also a plus."


The measurement platform leaders trust
Labvanced is the leading online platform for running behavioural science research. It is used by tens of thousands of researchers across psychology, neuroscience, linguistics, marketing, and human-computer interaction. By using Pagegazer you will get academic grade results, without the hassle of running the study yourself.
Academic customers using Labvanced
Harvard UniversityStanford UniversityUniversity of CambridgeNYUUCLA Carnegie Mellon University
 Northwestern University
 Penn State University
 Max Planck Institute
 Ludwig Maximilian University Munich
 Technical University of Munich
 TU Berlin
 École Normale Supérieure
 University of Manchester
 Aix-Marseille University
 National University of Singapore
… and 1,500+ universities worldwide. See the full list on Labvanced.com →
Labvanced powered research has been published in
Industries we serve
Pick the one closest to your business. Each industry tile takes you into the research area we'd most likely run a study in.
CPG / FMCG
Packaging & shelf testing, in-store displays, brand asset evaluation, print and POS materials, concept testing
Platforms / SaaS
User experience, CTAs, menu optimization, onboarding, feature adoption, competitor benchmarking
Retail / E-commerce
Webshop analysis, checkout flow, conversions, browsing behavior, product page testing
Media / Advertising
Social media ads, website banner videos, tutorials & explainers, TV ads & more
Pharma / Healthcare
Patient-app UX, DTC ad testing, OTC packaging & inserts, HCP detailing aids, cognitive load of patient-facing materials
Behavioral Insights Teams
IATs, reaction-time decisions, conjoint, neuro-cognitive measurement, custom experiments
What we research
Four research areas, organised by the kind of measurement and the kind of decision the findings need to support.

Digital Experience
Test your website, webshop, or digital design. See where attention goes, where it drops, how users interact, and what to change.

Packaging & Visual
Test packaging, shelf placement, logos, and print design. See which visuals capture attention, and drive preference.

Ad & Video
Test social content, video ads, and campaigns. Track attention, engagement, and emotional response.

Behavioral & Custom
Implicit testing, decision research, neuro-cognitive measurement, and bespoke studies for questions that go beyond attention.
How we work
Six phases, fully managed. Most projects complete in 4 to 8 weeks from brief to readout.
01
Brief
A 30-minute discovery call to understand the decision the research needs to support, the audience, and the timeline. We confirm scope and price in writing.
02
Consult
We work through the strategy together, and decide which questions to prioritise, which signals to measure, and whether the test design is technically sound for the inference you want to draw.
03
Setup
We implement the study: include the stimuli, configure the measurement, set up the participant flow, and pilot it to validate data quality before launch.
04
Collect Data
Recruitment and data collection run online, in participants’ own browsers. We will keep you updated about the progress via our client portal.
05
Analyse
We clean and process the data, run statistical testing, compute AOI and signal metrics, and synthesise findings across the four measurement channels.
06
Readout
We share a written report with the answers, the evidence, and concrete recommendations. A 60-minute readout call plus follow-up questions up to 2 weeks after included.
What you get
Findings written for the people making the decision, backed by the underlying data.
Findings report
Written report with the answers, the evidence, and concrete recommendations.
Visualizations
Heatmaps and scanpaths for layouts and stimuli, arousal and emotional response over time.
AOI metrics
Time-to-first-fixation, dwell time, fixation count, click and hover counts, arousal and emotional response per region.
Readout call
A 60-minute presentation with the research lead, plus follow-up questions up to 2 weeks after the readout.
Raw data output
The underlying data, cleaned and anonymised, for your team to explore at your own time.
Interactive analyser access
3 months access to our interactive analyser tool to explore the data and visualizations in Labvanced.
In depth
Methodology spotlights and notes on how the underlying research is done — and what it can answer for commercial questions.
How webcam eye tracking works — and how we validated it
A look at the science behind browser-based eye tracking, how it compares to laboratory hardware, and what makes it viable for commercial research.
Methodology spotlight: webcam eye tracking is good enough to study reading
Recent peer-reviewed work shows webcam-based eye tracking can resolve fine-grained reading behaviour. The implication for digital experience research is direct.
What packaging attention research actually looks like
A practical walkthrough of how a shelf-attention study is designed, what it measures, and what published research has shown about packaging cues.
Built for enterprise procurement
Security & data protection
All data is stored and processed in the EU, fully GDPR-compliant. Labvanced has undergone independent VAPT.
On-device processing
Raw camera images and video never leave the participant’s device. Only derived signals are transmitted.
Peer-reviewed accuracy
Eye-tracking validated against EyeLink 1000 in Behavior Research Methods. 1.4° spatial accuracy.
NDA, SOW, DPA ready
We sign client NDAs as a default. Templates for SOWs and DPAs are ready.
Procurement pack
A series of documents covering security, technical and organizational measures, sub-processors, the DPA template, and answers to the standard procurement questionnaire. Built for the legal and infosec reviewers on your side.
Common questions
What does a typical engagement cost and take?
Most engagements are €15,000–€20,000 and run 4 to 8 weeks from kickoff to readout. Simpler, focused studies start from around €5,000 (lean design, smaller sample, targeted analysis); complex or large-scale multi-method work runs to €50,000+. We confirm scope and price in writing before anything starts.
Can you combine eye tracking with a survey?
Yes. Surveys and self-report run in the same study as the implicit signals (eye tracking, facial expression, heart rate, behaviour). That lets us compare what participants say against what they actually did, and segment the results by demographics, attitudes, or any survey response, so attention and behaviour can be analysed per audience group. Self-report complements the implicit measures, it does not replace them.
Can you sign our NDA / DPA?
Yes. We sign client NDAs as a default. We also provide templates for DPAs and SOWs; we are also happy to review and sign yours.
Where is participant data stored, and for how long?
All data is hosted in EU regions on infrastructure we operate. All biometric measurements are processed in the participant’s browser and not transmitted. By default, all data is deleted 3 months after the engagement closes. Longer retention can be arranged if needed.
Can you recruit participants in our market and language?
Yes. We have panel partners covering Europe, North & South America, Africa, and selected APAC markets, with multilingual study delivery. Where you have your own customer panel, we can run the study against that instead.
Who owns the findings and the data?
You fully own all the findings, the raw data, and other deliverables we prepare during the engagement.
Can you work alongside our existing team / agency?
Often, yes. Pagegazer is most useful where attention and biometric data complement what surveys, analytics, or qualitative work cannot answer. We frequently sit alongside an existing research lead or agency.
Have a research question?
Let's discuss whether we're the right fit.